Prevent Crashes with Log Analysis Tools for Magento 2
What if you could predict and prevent your store crashes before they happen? Log analysis tools for Magento 2 turn raw system data into actionable insights.
The article explores the working, use cases, and popular log analysis tools.
What are Log Analysis Tools for Magento 2?
Log analysis tools enable developers and administrators to track and troubleshoot log files.
Magento 2 generates logs for system errors and debugging. These help maintain optimal performance and stability.
These tools simplify the review of log data through filtering and alerting features. It helps detect issues and optimize the system. Popular tools include the ELK Stack and Datadog.
These platforms provide centralized logging and integrations with Magento’s backend. Magento-specific modules offer direct access to logs. These include Magerun CLI and admin panel log viewers.
Log analysis tools uplift site reliability and enhance security. It also reduces downtime with proactive monitoring and faster issue resolution.
How Magento 2 Log Analysis Tools Work?
How Magento 2 Log Analysis Works
Generation
Logs created automatically
Collection
Agents gather log data
Parsing
Extract structured data
Storage
Index for fast queries
Visualization
Dashboards & alerts
1. Log Generation
Magento 2 is a complex system that logs various activities by default. They log them through custom modules. These logs help track everything from routine operations to critical failures. The most common log types include:
-
System.log records core activities and notices.
-
Exception.log captures uncaught PHP exceptions with detailed stack traces.
-
Debug.log logs verbose output that is useful during development or testing.
-
Custom.log modules or extensions can generate their custom log files.
Store all these files in/var/log/ and update them based on site activity.
2. Log Collection
Log collection tools scan and forward logs from Magento servers to centralized platforms. It uses:
-
Agents like Filebeat or Logstash track specific directories and files.
-
Cloud agents can forward logs to a centralized location for analysis and monitoring. These include Datadog Agent or AWS CloudWatch Agent.
The collection methods include:
-
Real-time streaming
-
Scheduled polling
-
Push/pull mechanisms
These tools are often configured via YAML or JSON files. They help define file paths and output destinations.
3. Log Parsing
Once collected, parse the logs to convert unstructured text into structured data. It helps them to query and analyze. Parsing tools extract meaningful fields from each log line using:
-
Grok Patterns are regex-based templates that define patterns.
-
JSON/Key-Value Parsing is a structured log from APIs or custom modules.
-
Tagging helps categorize logs by type or environment.
Parsed fields might include:
-
timestamp
-
log.level
-
error_type
-
file_name
-
line_number
-
message
Tools like Logstash or Graylog Pipelines handle the transformation.
4. Storage
Once parsed, store the logs in high-performance indexing systems. It allows fast queries and retention policies:
-
Use Elasticsearch in the ELK stack. It is great for full-text search and aggregations.
-
Graylog combines MongoDB and Elasticsearch for log indexing and metadata.
-
Datadog and AWS CloudWatch offer managed storage with auto-scaling and role-based access.
The benefits include:
-
Store logs from various Magento servers in a single location.
-
Archive logs for compliance.
-
Apply access controls based on role or project.
5. Visualization & Alerts
Log analysis tools offer intuitive interfaces and dashboards. It is where log analysis becomes powerful for Magento operations.
-
Kibana visualizes error rates and user actions.
-
Graylog is a powerful query-based dashboard.
-
Integrate Datadog or New Relic with performance metrics and user experience analytics. It helps gain actionable insights into your system.
Admins can:
-
Create charts for slow queries or failed transactions to identify areas for improvement.
-
Set alerts for specific log patterns or spikes in error rates.
-
Correlate logs with application or infrastructure events to gain deeper insights.
5 Popular Log Analysis Tools for Magento 2
1. Graylog

-
Graylog is a centralized log management platform. It comes with a modern UI, powerful search capabilities, and real-time alerting.
-
The open-source version is free, while the enterprise version incurs a cost of $ 2 or more per GB.
-
It is best for Magento teams seeking a centralized and self-hosted logging solution.
Key Features:
-
Centralized log collection and analysis
-
Flexible alerting and notification system
-
REST API for custom integrations
-
Stream processing capabilities
Pros:
-
There is a good balance of features and cost
-
It offers strong search and analysis capabilities
-
It offers flexible architecture
-
It supports an active open-source community
Cons:
-
The user interface is less polished than commercial alternatives
-
It requires some technical expertise to set up
-
Limited built-in integrations compared to commercial tools
2. ELK Stack
-
The ELK Stack includes Elasticsearch, Logstash, and Kibana. It is a powerful open-source log analysis and visualization platform suite.
-
Ship Magento logs using Filebeat or Logstash. Index it in Elasticsearch and visualize it via Kibana.
-
The self-hosted platform is free, whereas Elastic Cloud incurs a monthly fee of $ 95 or more.
-
It is best for large enterprises with dedicated DevOps teams and dedicated infrastructure. The ELK Stack handles over 100TB of log data daily for major e-commerce sites.
Key Features:
-
Real-time log search and analysis
-
Custom dashboards and visualizations
-
Scalable architecture supporting massive data volumes
-
Advanced alerting and notification systems
Pros:
-
It offers powerful search and visualization
-
It handles massive scale
-
It supports a strong open-source community
-
Flexible deployment options
Cons:
-
Setup and maintenance are complex
-
It requires significant technical expertise
-
Infrastructure needs are resource-intensive
-
Learning curve for non-technical users
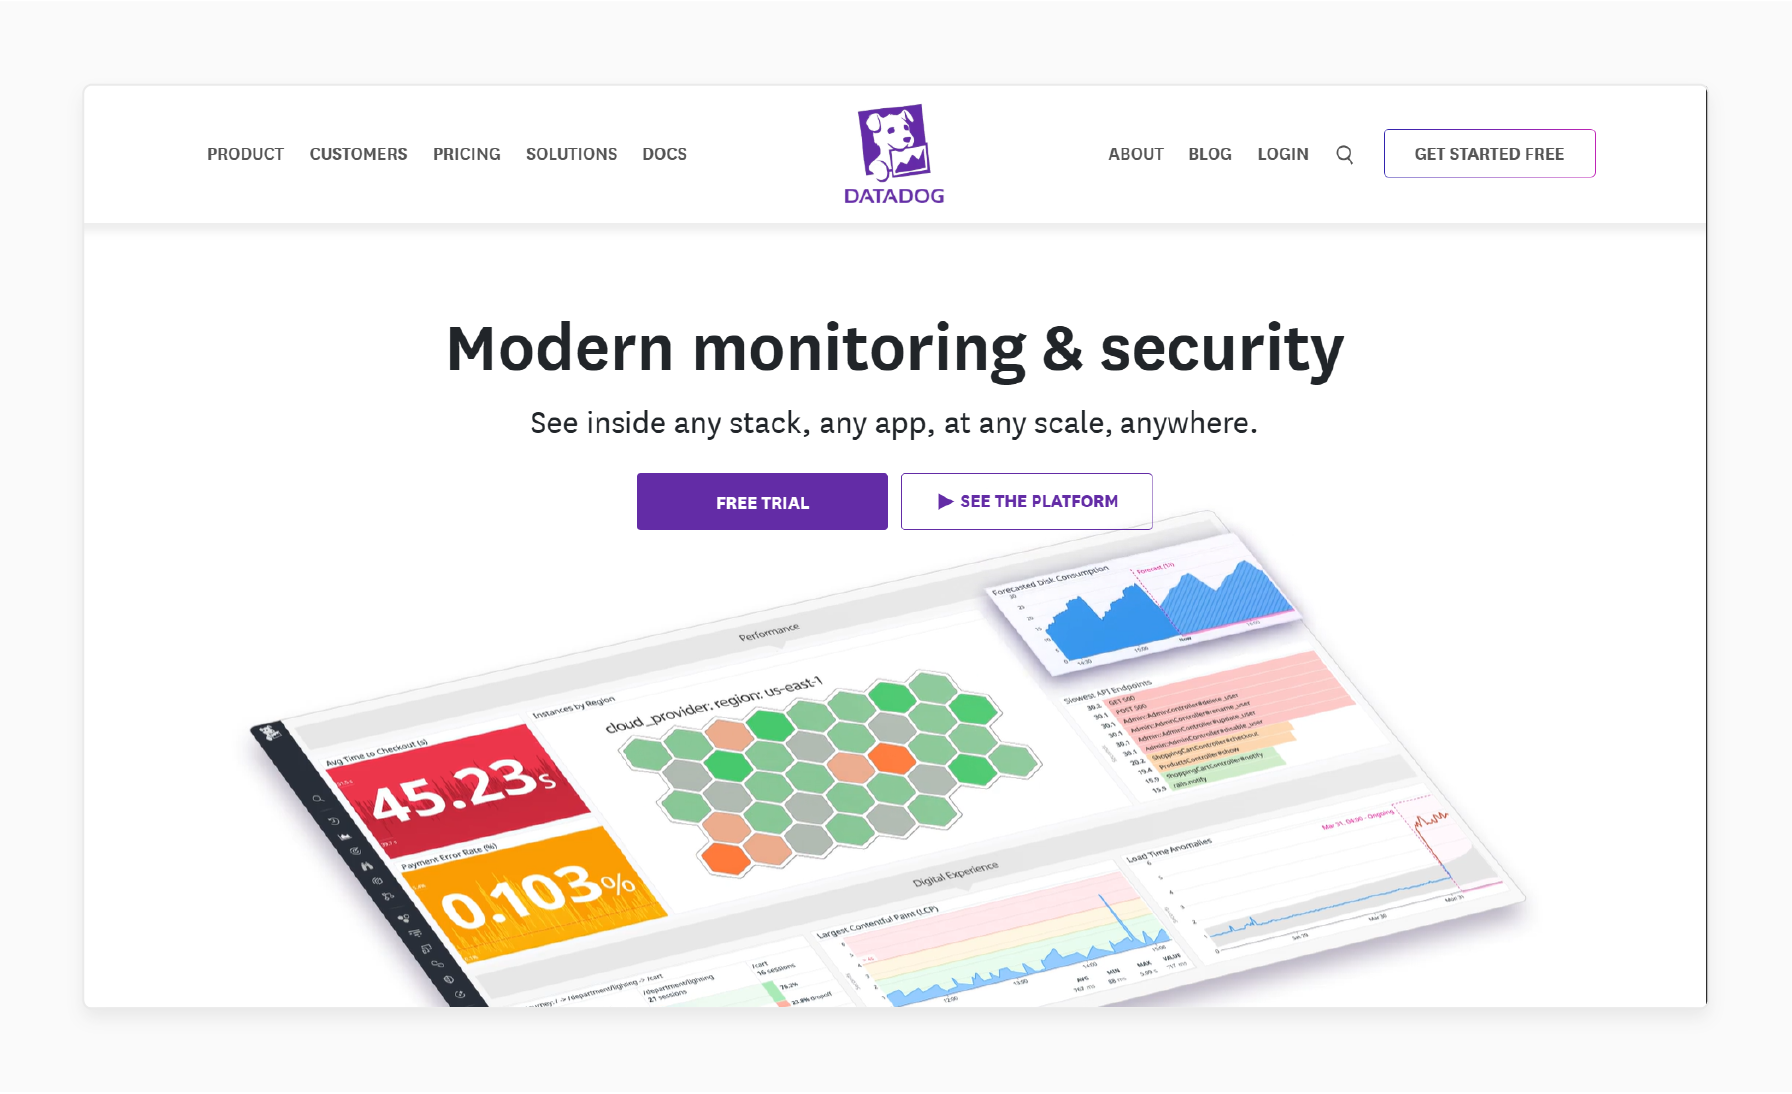
3. Datadog

-
Datadog is a cloud-based monitoring and analytics platform. It offers integrated log management and infrastructure monitoring. It incurs $15-23 per host per month.
-
It is best suited for SaaS Magento stores and teams. They use containerized or Kubernetes environments.
Key Features:
-
AI-powered anomaly detection
-
Pre-built Magento 2 dashboards
-
Application Performance Monitoring
-
Alerting and notifications
Pros:
-
It offers an excellent user interface and experience
-
There are strong AI and machine learning capabilities
-
Comprehensive monitoring beyond logs
-
Outstanding customer support
Cons:
-
It incurs a higher cost for small businesses
-
Vendor lock-in concerns
-
Advanced features need higher-tier plans
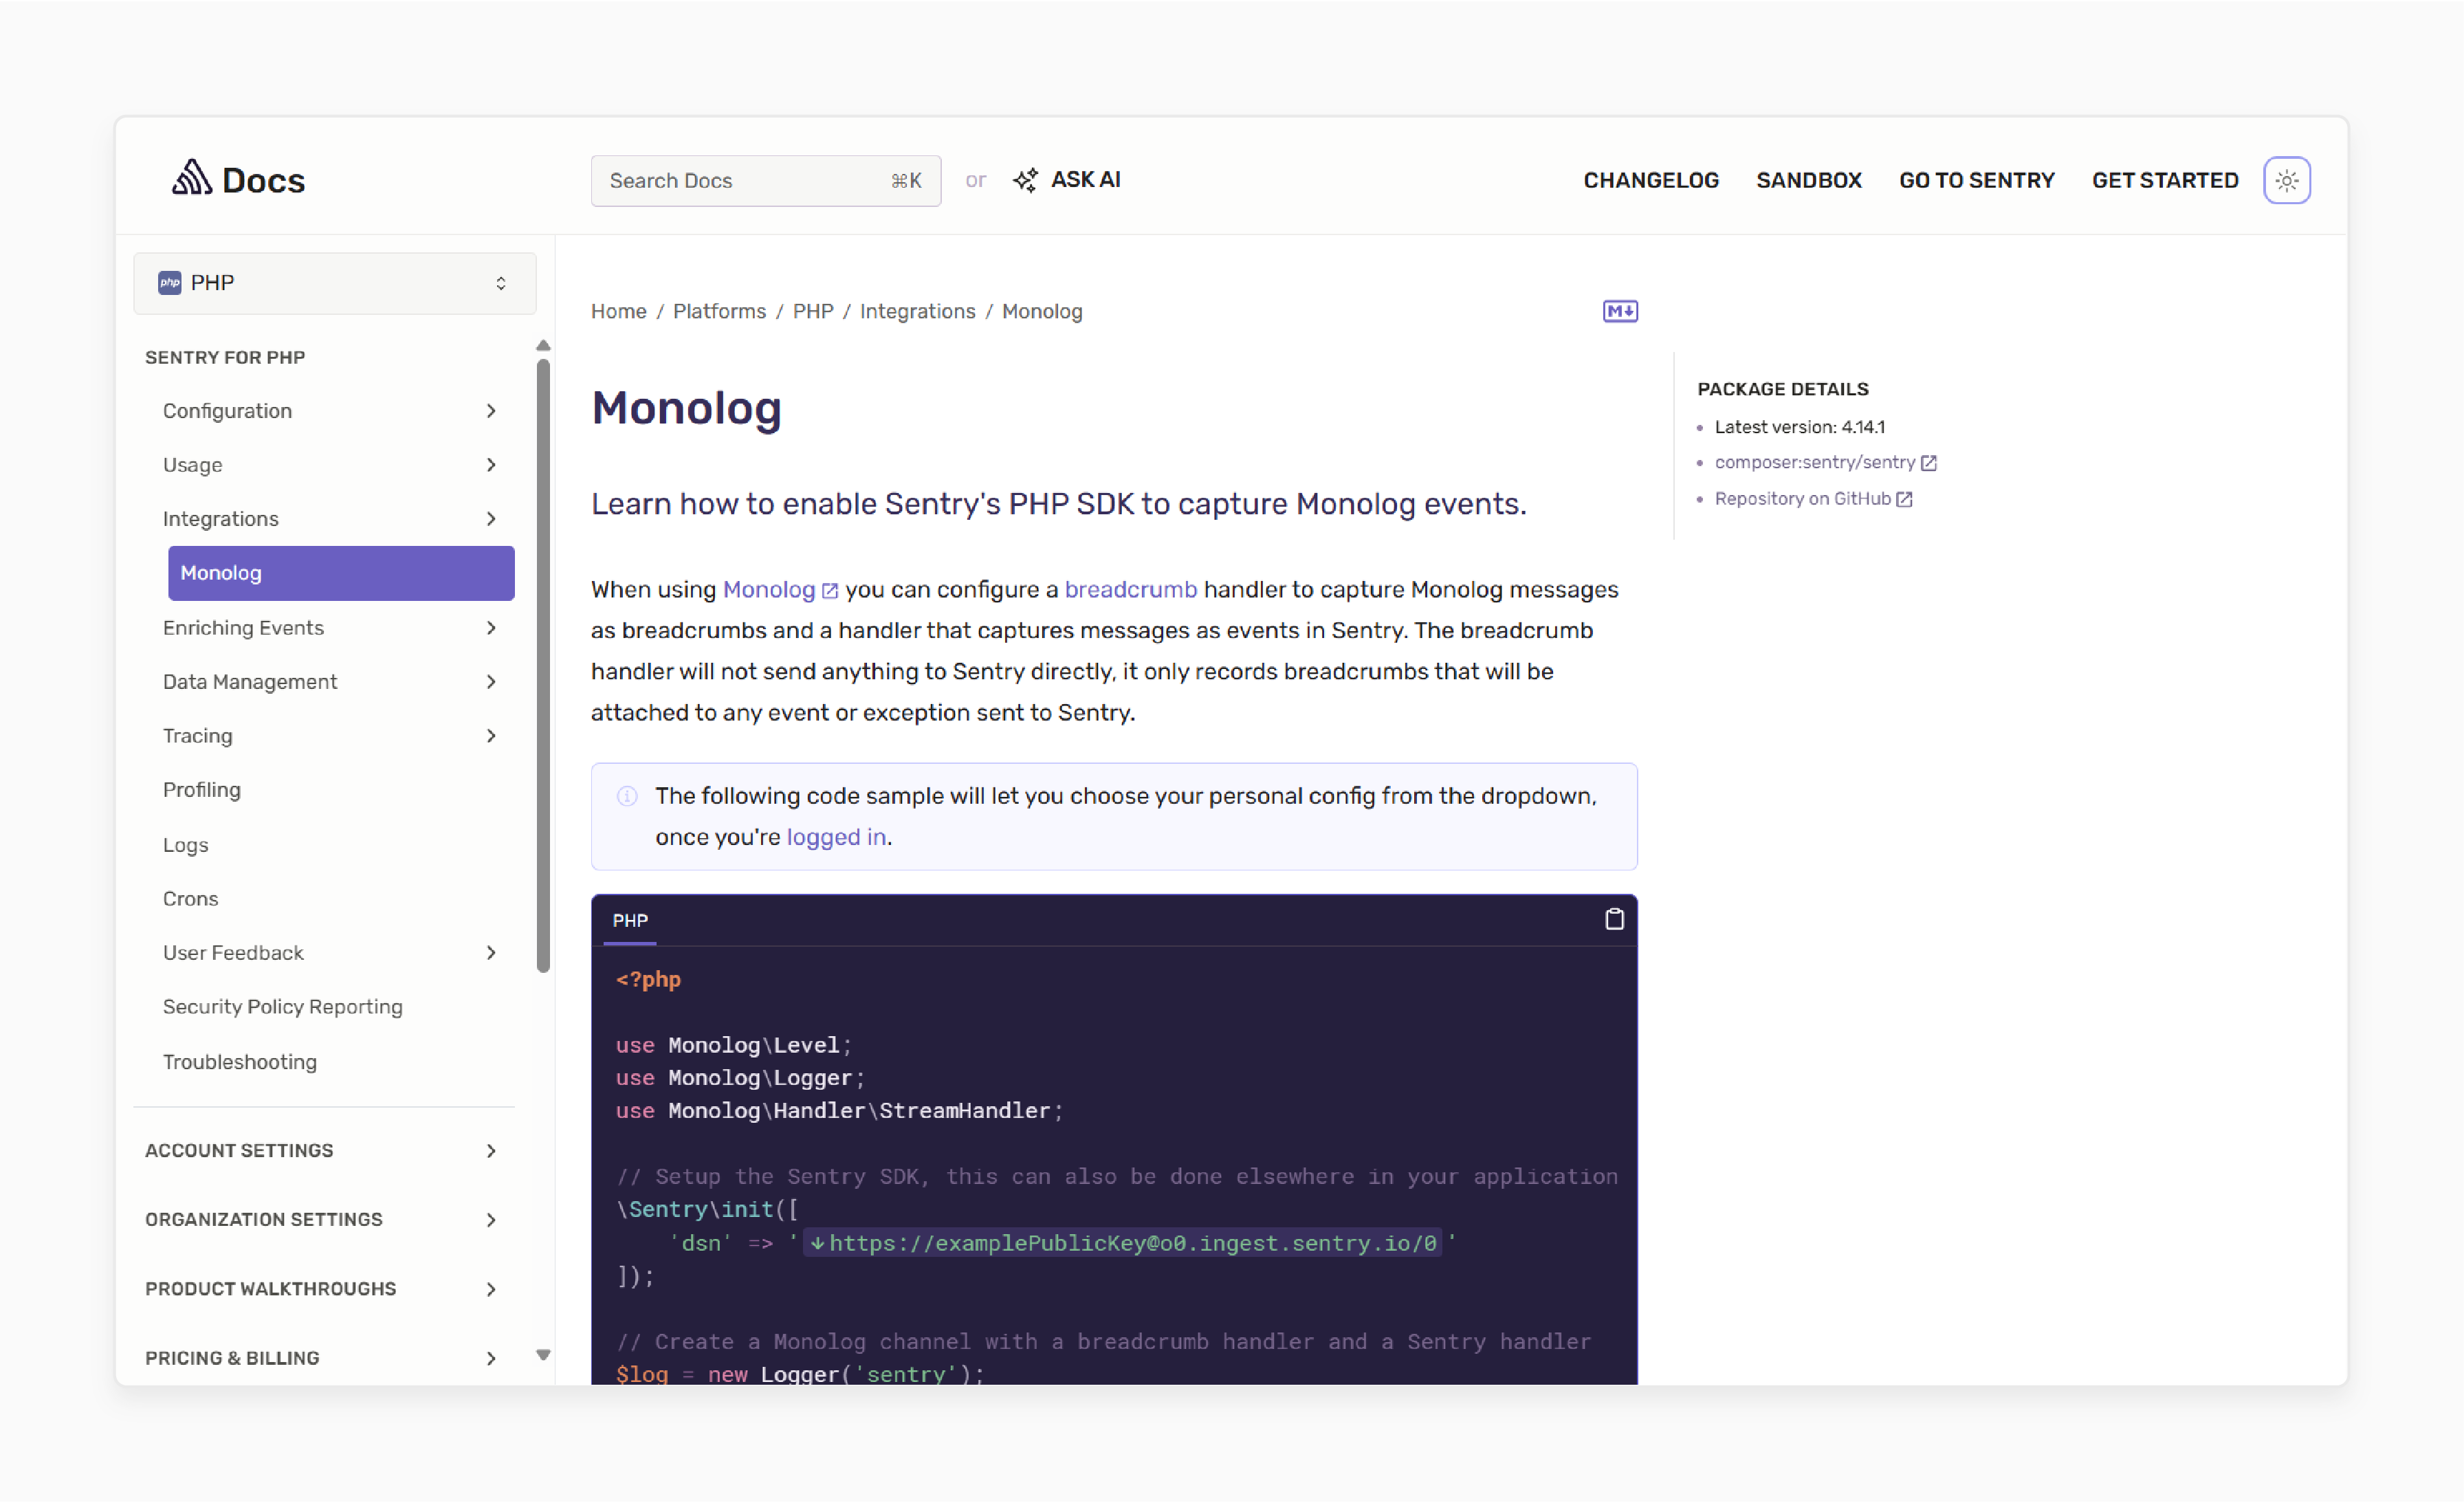
4. Monolog

-
Magento 2 uses Monolog as its core logging library. It supports various log handlers and output formats. It is free to use.
-
It is best suited for developers to create custom modules or enhance the logging system.
Pros:
-
It offers native integration with zero setup
-
It supports various output formats
-
Extensive documentation and community support
-
There are no extra licensing costs
Cons:
-
It requires server access to view logs
-
There are no built-in visualizations or dashboards
-
It needs a manual log rotation setup
-
Limited real-time monitoring capabilities
5. Native File System Access
-
Magento logs events to the local filesystem by default via FTP or hosting control panels. It is free to use.
-
It is best suited for small stores or those integrating logs into larger platforms, such as ELK.
Pros:
-
It offers immediate access to raw log data
-
It doesn't need extra tools
-
It works with any hosting environment
Cons:
-
It is time-consuming for large log files
-
There are no search or filtering capabilities
-
Difficult to correlate events across various logs
-
It is not suitable for ongoing monitoring
3 Real-World Use Cases of Log Analysis Tools
Real-World Success Stories
See how leading brands leverage Magento 2 logging to solve critical issues
Björn Borg
Premium Fashion Brand
The Challenge
Discounts were not being applied during flash sales, causing customer frustration and lost revenue during critical promotional periods
The Solution
Used Mageplaza log viewer to identify failed catalog_rule_apply_all cron job due to memory limits
The Result
Adjusted cron settings and increased memory allocation, restoring discount functionality within 2 hours
Impact Metrics
"Log analysis helped us identify a critical issue in minutes that would have taken hours to debug manually"
Tom Dixon
Luxury Design Brand
The Challenge
Backend users reported extreme latency in the sales order grid, impacting daily operations and productivity
The Solution
New Relic APM + Logs revealed slow SQL queries and insufficient indexing on sales tables
The Result
Query optimization and database tuning resulted in 65% reduction in page load time
Performance Gains
"The visibility into SQL performance through log analysis transformed our backend operations"
Peach & Lily
K-Beauty Leader
The Challenge
Orders stopped syncing with warehouse system, disrupting fulfillment operations during peak season
The Solution
Sumo Logic surfaced repeated 401 REST API errors due to expired authentication tokens
The Result
Updated integration script to refresh tokens automatically, restoring 100% order sync rate
Integration Success
"Real-time log monitoring saved us from a major fulfillment crisis during peak season"
5 Common Challenges and Solutions of Log Analysis Tools
1. Log Overload & Noise
High-volume Magento stores generate massive amounts of log data. It is particularly true in system.log and debug.log. It is difficult to separate critical issues from routine entries.
Solution:
-
Use log rotation and archival policies.
-
Use structured logging with log levels, such as INFO and ERROR.
-
Filter logs in tools like Graylog or ELK using tags and time ranges to refine your search.
2. Lack of Centralized Logging
Scatter logs across various servers or containers in multi-node Magento deployments.
Solution:
-
Deploy central logging platforms, such as Graylog and Sumo Logic.
-
Use log shippers like Filebeat or Logstash handlers to push logs to a single destination.
-
Standardize log formats, such as JSON enables data analysis and interpretation.
3. Performance Impact on Production
Excessive logging or real-time log analysis can affect performance. It is especially true on high-traffic Magento sites.
Solution:
-
Limit debug-level logging in production.
-
Use asynchronous log handlers, such as queues or remote APIs, to handle log data.
-
Offload log parsing and storage to external log servers.
4. Insufficient Visibility for Non-Developers
Business or support teams can't access or interpret technical logs.
Solution:
-
Use tools such as Mageplaza Log Viewer or dashboard plugins.
-
Set up custom alerts or visual dashboards for key metrics. These include failed checkouts or cron errors.
-
Integrate logs with the helpdesk or notification platforms. These include Slack or Zendesk.
5. Identifying Root Causes
It is difficult to correlate logs across systems, such as Magento and the database. You cannot find the root cause of the issues.
Solution:
-
Use correlation IDs for tracing across Magento logs and external services.
-
Use APM tools like New Relic. It combines logs and metrics.
-
Configure Sentry or Sumo Logic to group and check error trends.
Frequently Asked Questions
Still Have Questions?
Our team of Magento experts is here to help you implement the perfect log analysis solution
Contact SupportSummary
Magento 2 log analysis tools help developers track and optimize store performance. The article explores the key points of the tools, including:
-
Magento 2 logs include system, debug, and custom files stored in /var/log/.
-
Tools like Filebeat and Logstash collect and forward logs to centralized systems.
-
Parse logs using Grok patterns or JSON to extract structured insights.
-
Visualization and alerting tools, such as Kibana, enable real-time monitoring.
Enhance your store’s performance and security with powerful log analysis. Pair it with managed Magento hosting to handle monitoring.


