How to Enable Magento 2 Profiler?
The Magento 2 Profiler serves as an embedded debugging tool. Its primary function is to pinpoint performance issues present on the server. It also identifies the code blocks causing slow page loading and details the time each block takes to complete its task. This tutorial will guide you on how to enable the Profiler for Magento 2 stores. It will also cover the benefits of utilizing Profiler to enhance the overall performance of the website.
Key Takeaways
-
Learn how to activate the Profiler, identify code execution time, and enhance website performance.
-
Understand the three available formats - HTML, CSV, and Firebug - to visualize performance data for effective analysis.
-
Gain insights into how the Profiler identifies and enhances code efficiency for a better-performing store.
-
Explore detailed performance reports aiding in identifying critical areas, dependencies, and unused resources for optimization.
-
Understand common issues and their solutions when using Magento 2 Profiler for development.
What is Magento 2 Profiler?
Magento 2 Profiler helps you see the execution time of certain chunks of code, including the time for each query and executed parameters. It allows you to measure the efficiency of different code blocks and make improvements to enhance both memory usage and overall performance. It also checks if a third-party extension or add-on will be a good fit for your store.
Magento 2 supports three Profiler formats:
-
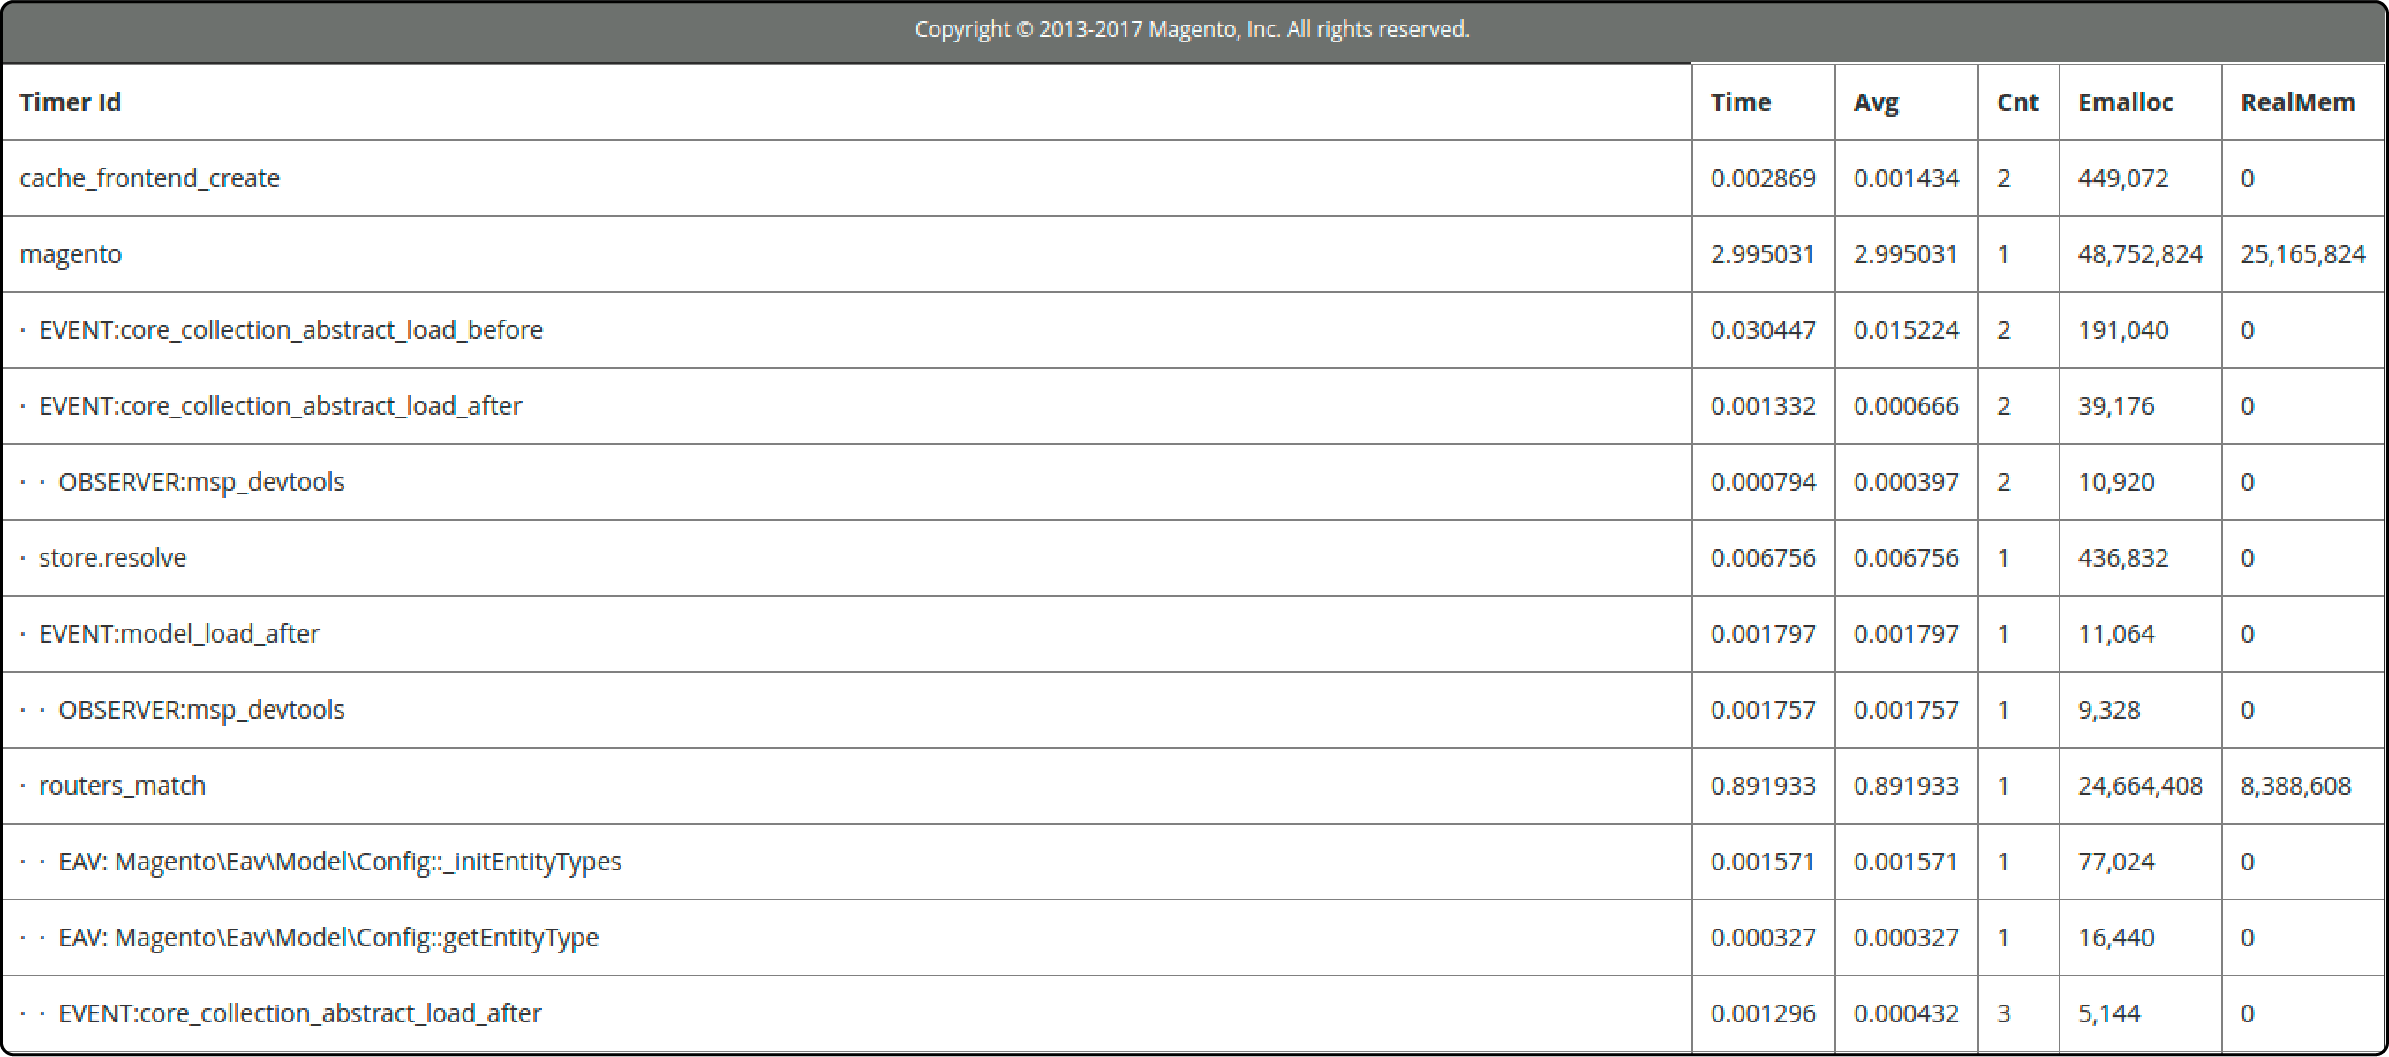
HTML: This format provides a user-friendly visual representation of the code execution time and query details.
-
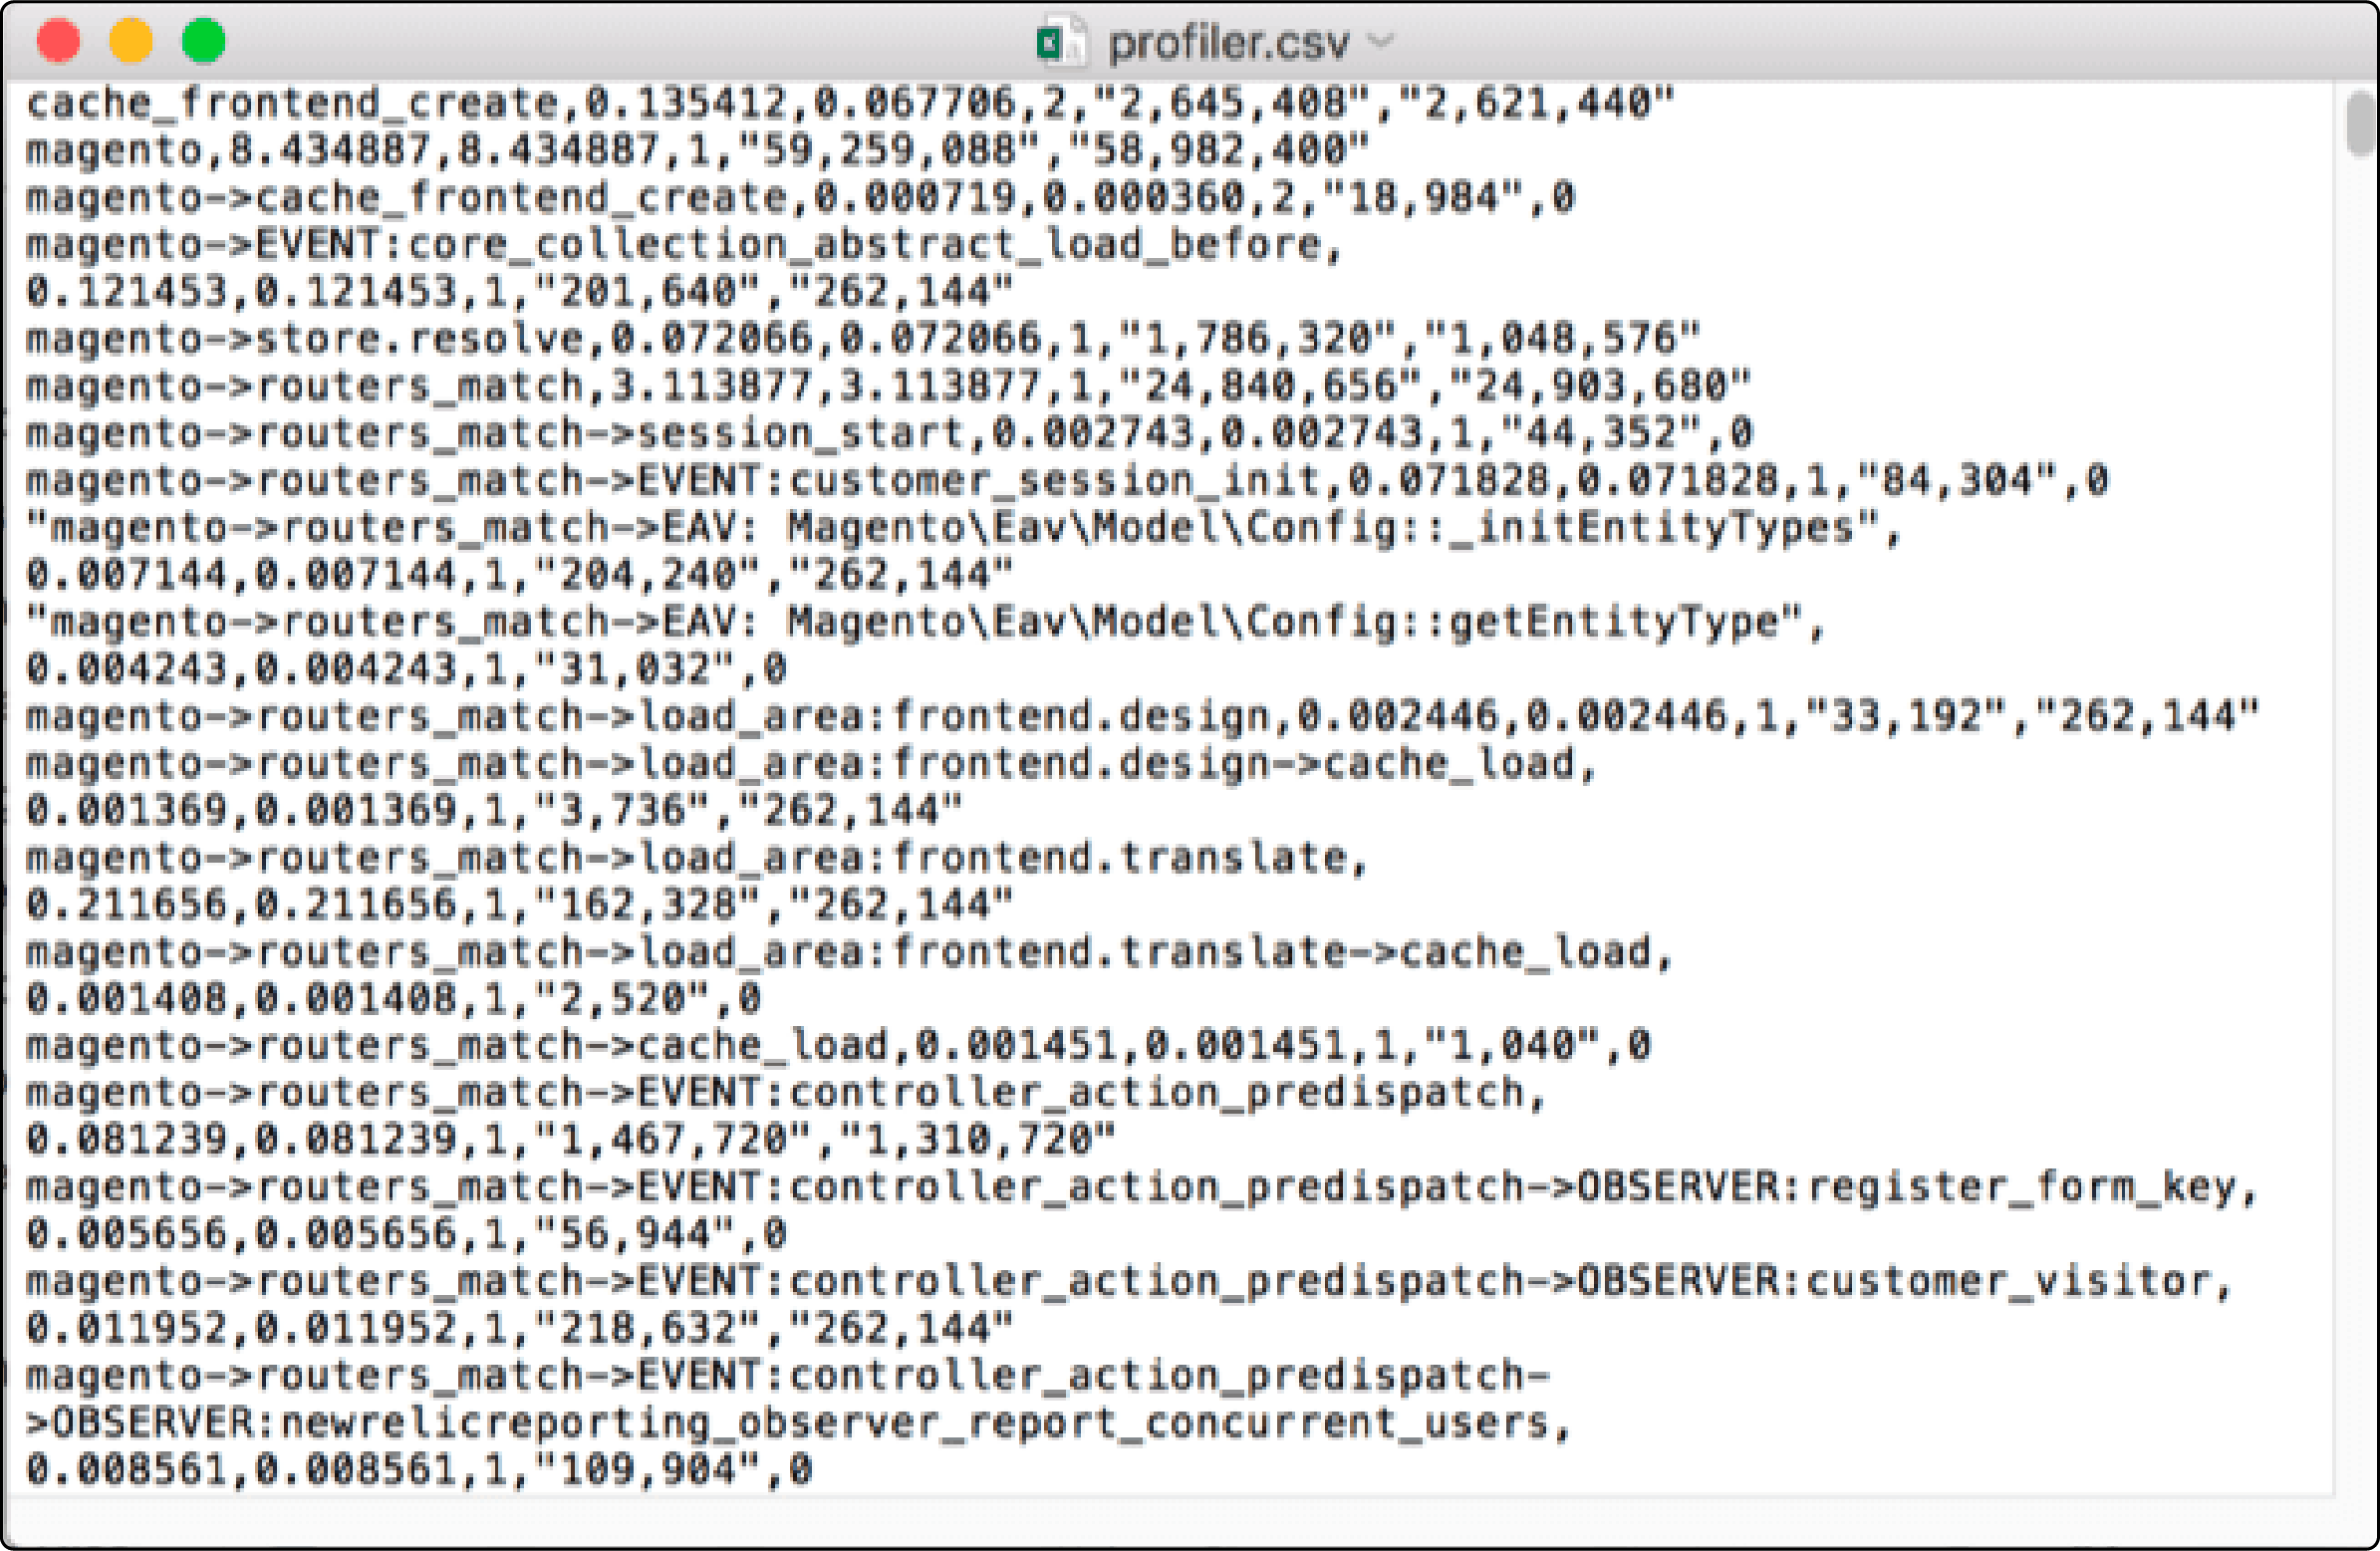
CSV File: You can export Profiler data in CSV format. It allows users to perform a more in-depth analysis and reporting.
-
Firebug: Firebug is another option for profiling. It provides developers with a Magento debugging tool that aids in identifying performance bottlenecks.
Benefits of Profiler for Magento 2 stores
Profiling helps speed optimization for your Magento 2 store. Activating the built-in Profiler, MAGENTO_PROFILER, brings several advantages, including:
-
Dedicated performance report: Enabling the Profiler triggers an automatic generation of a detailed performance report for your store. This report includes various timers involved in rendering the storefront. It provides insights into critical aspects such as
cache_frontend_createandcache_load. -
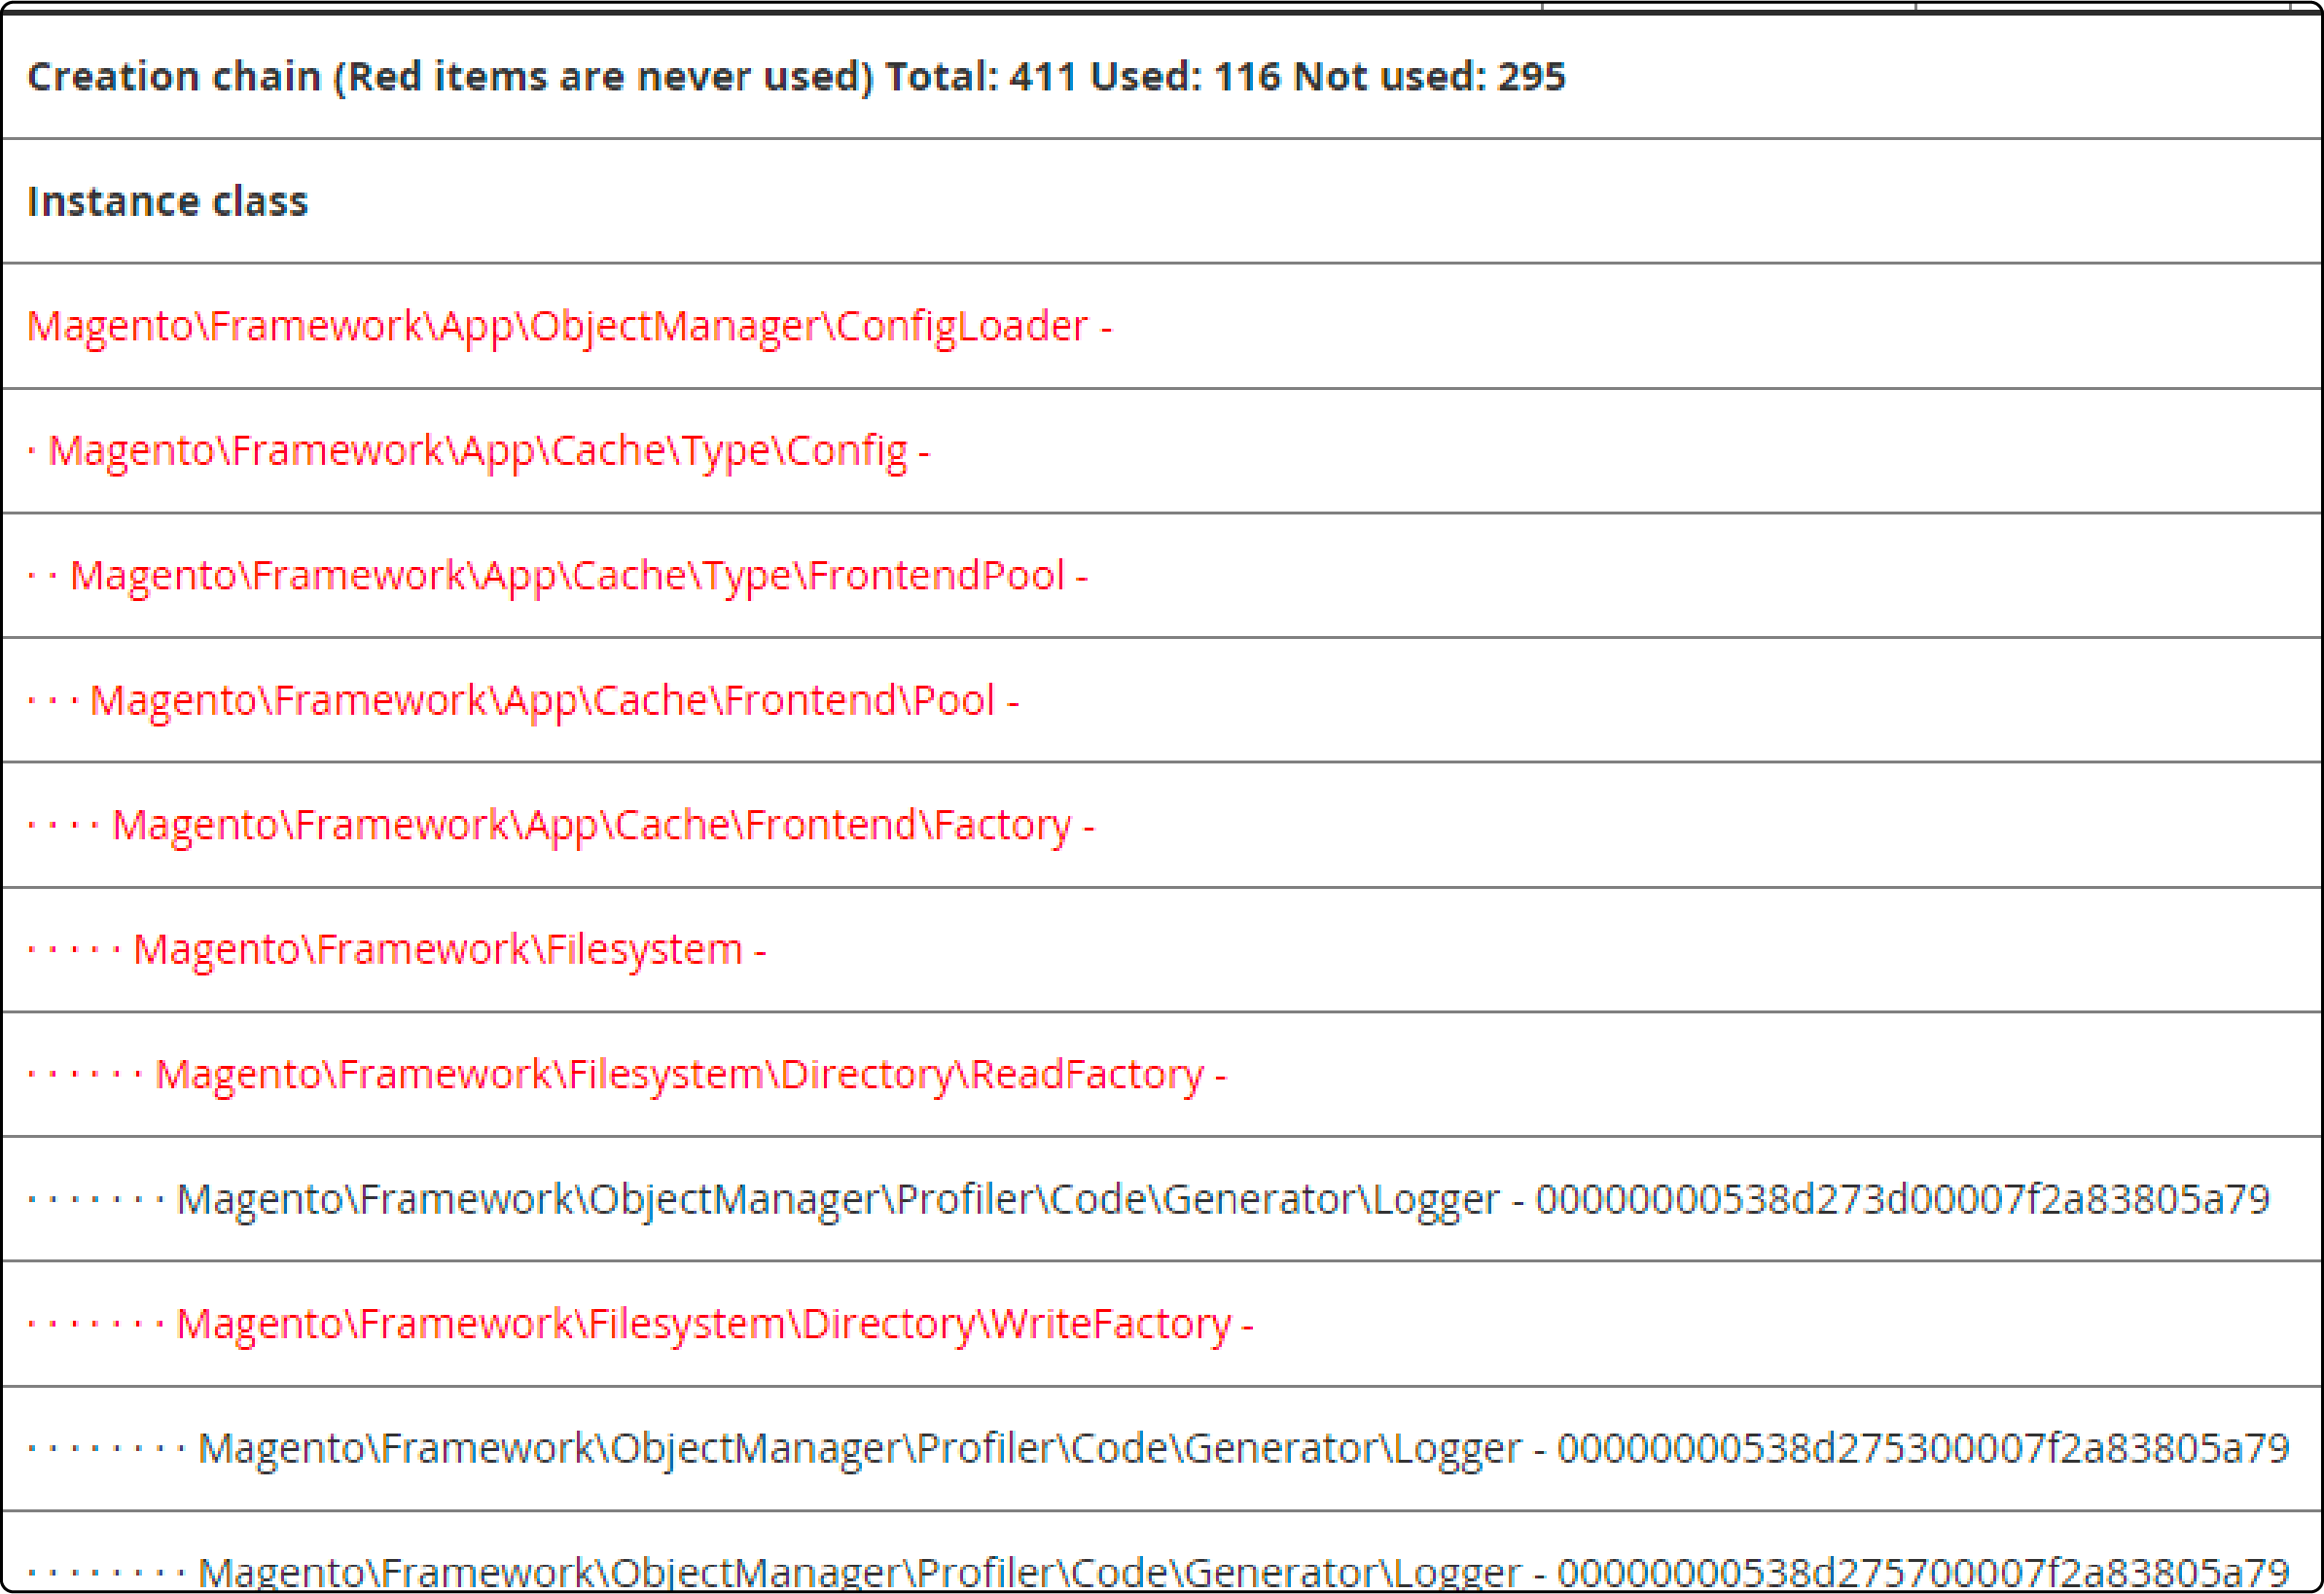
Dependency graphs: Configuring MAGENTO_PROFILER offers the option to enable dependency graphs. These graphs present a detailed list of the object dependencies utilized within your store. It also shows the unused dependencies. It helps you identify where processor time and memory could be utilized more.
Enable Magento 2 Profiler Using .htaccess File
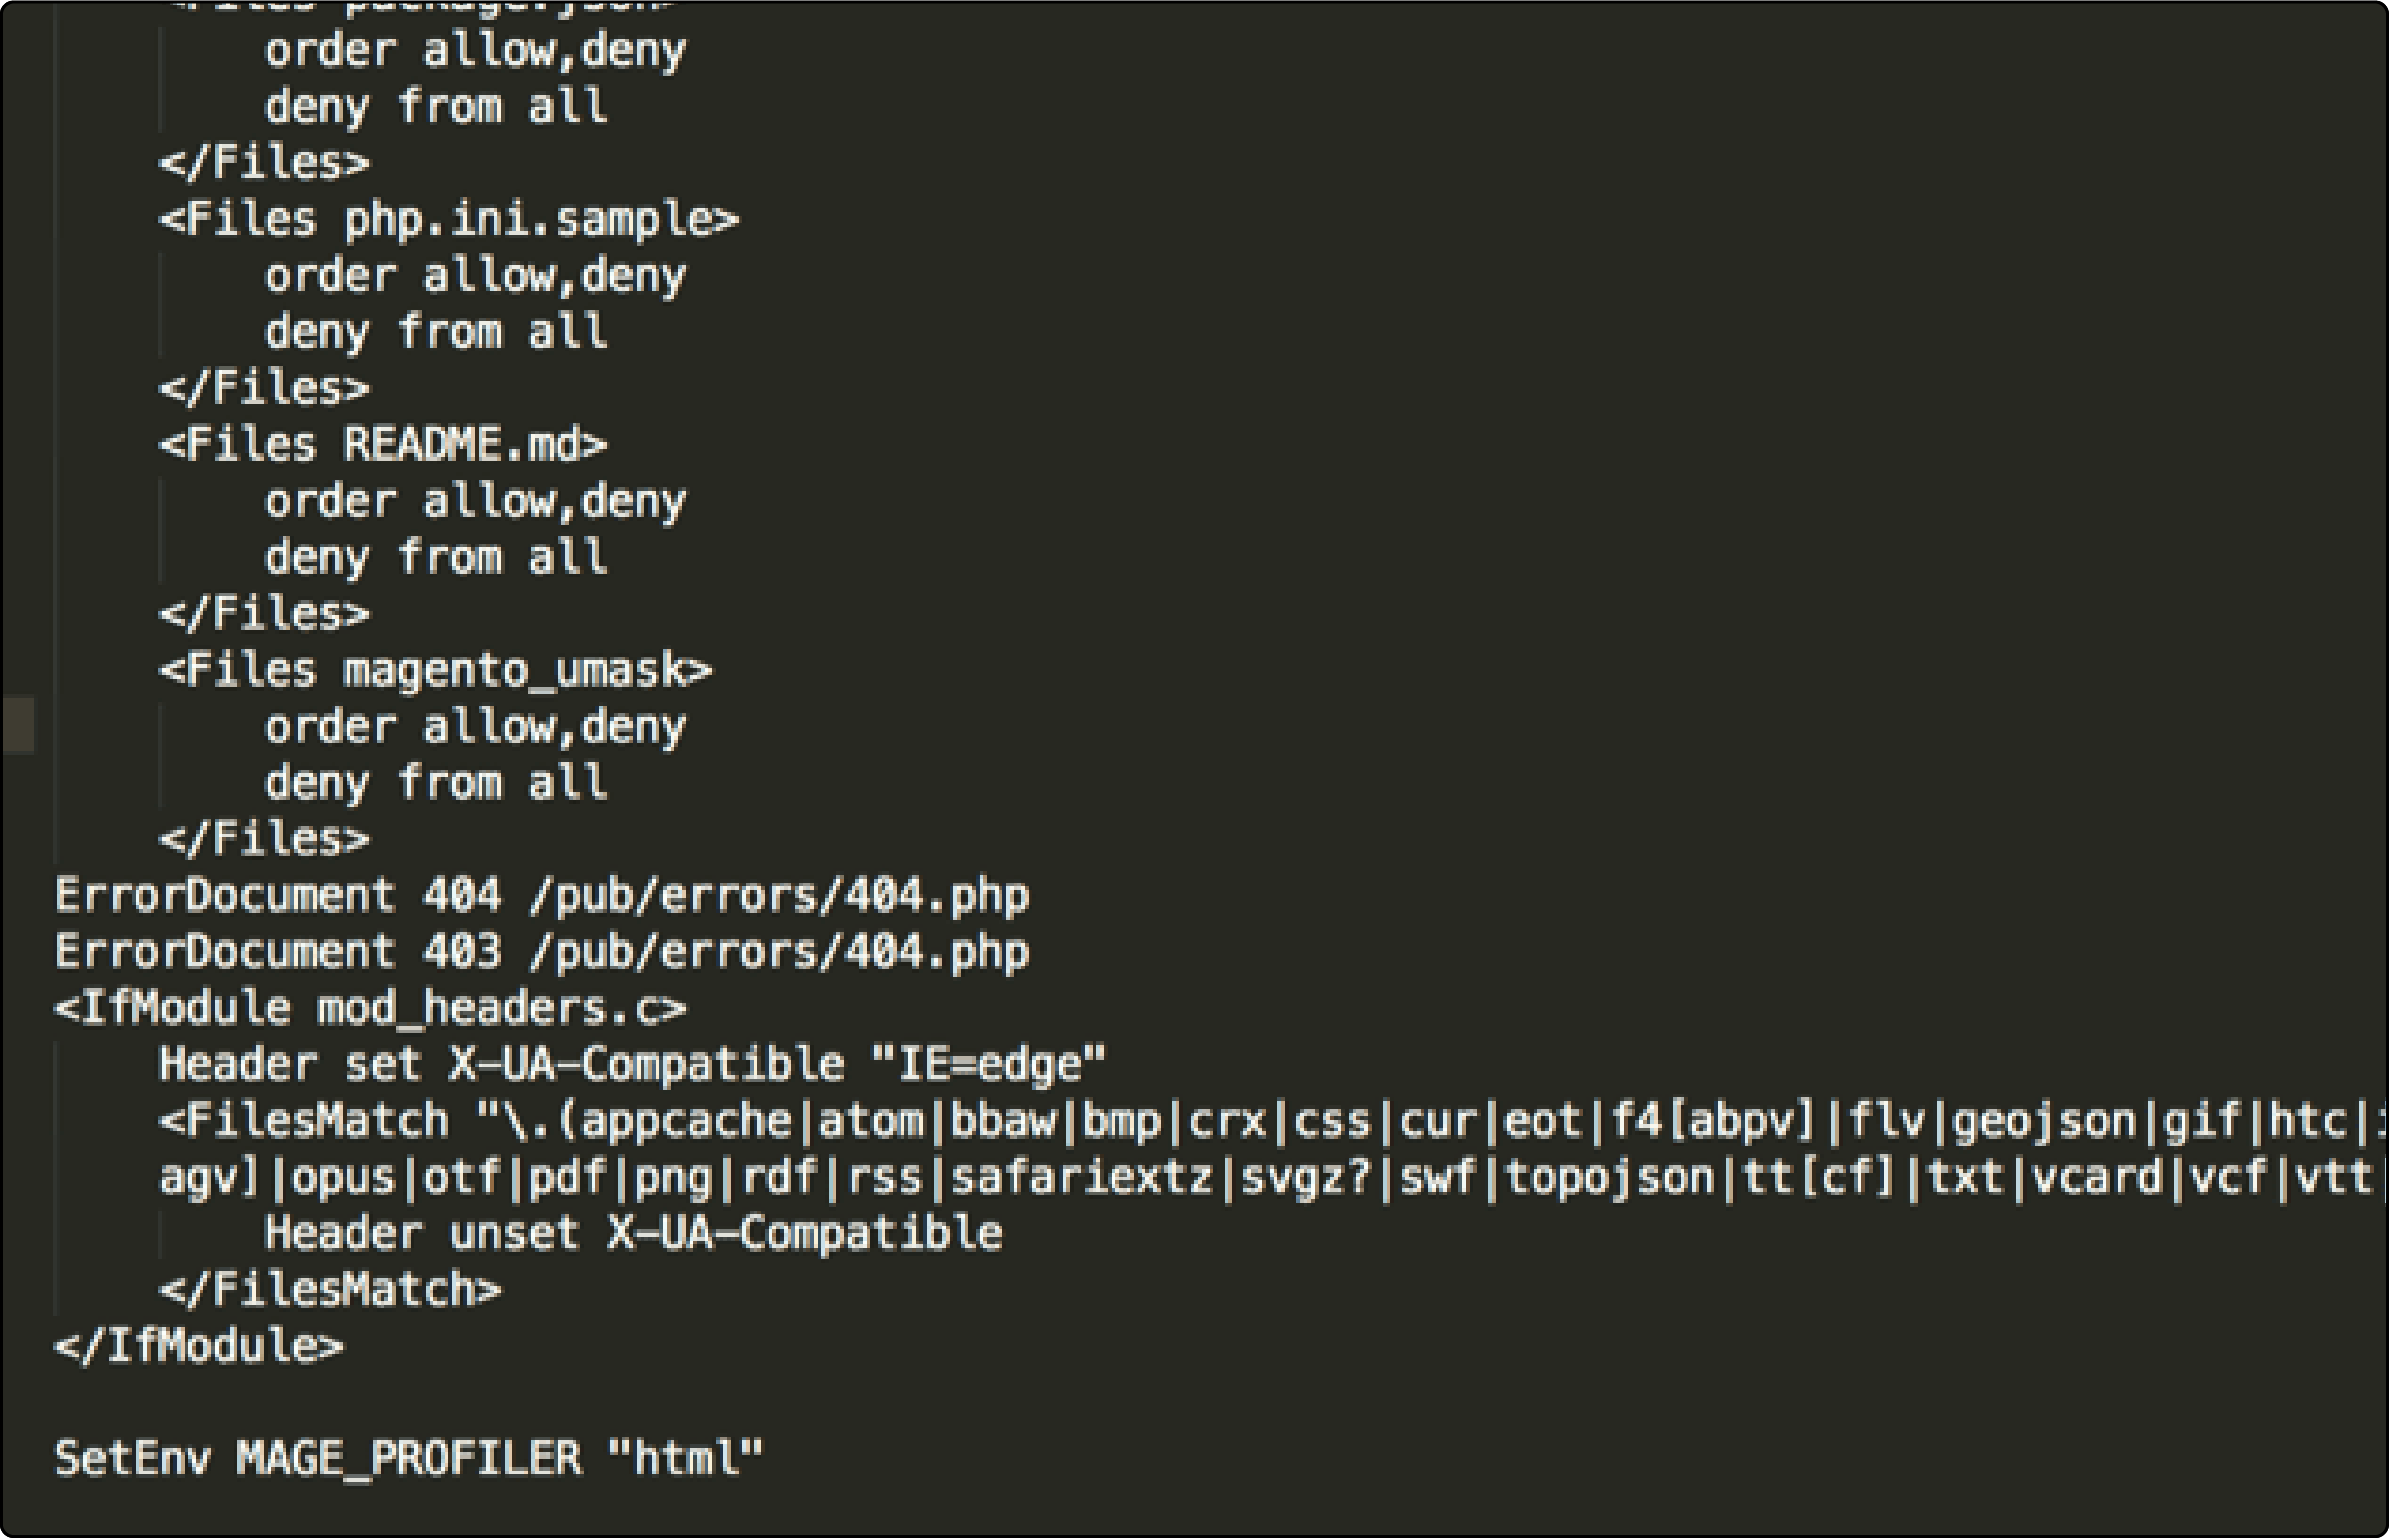
If your Magento instance is hosted on an Apache server, editing the .htaccess file is a quick way to enable the Magento Profiler.
Step 1: Add code to the .htaccess file
-
Access the root directory of your Magento store via FTP or SSH.
-
Locate and open the
.htaccess file. -
Insert the following code snippet into the
.htaccessfile:
# SetEnv MAGE_PROFILER html

- Save the changes you've made to the .htaccess file and then close it.
Step 2: Set value for MAGE_PROFILER
Set the value of MAGE_PROFILER in three different cases, each with its specific outcome:
-
CSV File: To generate reports in CSV format, navigate to
/var/log/profiler.csv. -
HTML: If you choose HTML, you'll discover performance results embedded as
HTMLcode blocks. They are present at the end of your store's homepage. -
Firebug: When opting for Firebug, you can access reports in
/var/log/profiler.csv. You can do this with the help of Firebug's output.

Step 3: Enable Developer mode
-
Log in to your SSH terminal.
-
Navigate to the Magento root directory of your store.
-
Run the following command:
php bin/magento dev:profiler:enable <type>
Step 4: Refresh cache
-
Go to the Magento admin panel > System > Tools > Cache Management.
-
Locate the dropdown menu positioned above the grid of cache options.
-
From the dropdown menu, choose the Refresh option.
-
Confirm your selection by clicking the Submit button.
Enable Magento 2 Profiler Using CLI Commands
Step 1: Enable Profiler
- To enable the Profiler in Magento 2, execute the following command:
php bin/magento dev:profiler:enable <output_type>
- You can choose between two built-in output types:
htmlandcsvfile.
Note: If you don't specify an output type (CSV file or HTML), the Profiler will default to HTML.
- The output is saved to
<project-root>/var/log/profiler.csv.
Note: The profiler.csv is overridden on each page refresh.
- To disable the profiler and remove the flag file, run:
bin/magento dev:profiler:disable
Step 2: Refresh the cache
- Refresh the cache by running the following command:
php bin/magento indexer:reindex
Checking Your Reports
After enabling the Profiler, you can check the reports based on your chosen configuration:
- HTML Profiler: If you've selected HTML as your Profiler type, you'll find the profiling data below the footer section of your storefront. To access it, simply open your homepage and scroll down. Here, you will see a list of timers and their time taken.

-
CSV File: If you opted for the CSV output type, a Profiler.CSV file will be generated in the
var/logdirectory.

- Dependency Graphs: If you've set the MAGE_PROFILER value to 2 in your .htaccess file, you'll encounter a specific page when accessing your storefront. This page will help you identify areas slowing down your system.

Troubleshooting Common Magento 2 Profiler Issues
If you encounter an error indicating that Magento 2 Profiler is not functioning correctly, consider taking the following steps to resolve the issue:
-
Ensure that you have correctly enabled the Profiler by following the steps in our previous section.
-
Double-check if you have added the necessary code to your
.htaccess fileand set the value for MAGE_PROFILER. -
Ensure you have properly enabled developer mode and refreshed your cache after making these changes.
-
If the Profiler is still not working, it could be due to HTML code causing JavaScript execution errors. You can resolve this by using other profile modes like csvfile.
Note: Ensure that the HTML Profiler doesn't interfere with the functionality.
FAQs
1. How can I disable Magento 2 Profiler once enabled?
To disable the Magento 2 Profiler after enabling it, navigate to the .htaccess file. Run the following command:
bin/magento dev:profiler:disable
It will disable the profiler and remove the flag file. Save the changes, and the Profiler will be disabled.
2. Where can I learn more about Magento web development using the Profiler?
You can expand your understanding of Magento web development with the Profiler by exploring official Magento documentation or community resources. It will provide valuable insights and practical examples.
3. Can I customize the display of the Profiler's performance results?
Yes, you can modify the display of the Profiler's performance results according to your preferences. The output formats, including HTML, CSV, and Firebug, offer varying visual representations of the data. You can also explore further options within Magento's Backend settings or extensions to tailor the display of the Profiler results.
4. How does Magento 2 Profiler aid in web development optimization?
Magento 2 Profiler offers insights into code execution time and identifying performance bottlenecks. It assists developers in pinpointing areas that need improvement, enhancing code efficiency, and ensuring the overall smooth functioning of the website.
Summary
Magento 2 Profiler provides valuable insights into your store's performance. It enables users to optimize code blocks, enhance performance, and assess the compatibility of third-party extensions. This tutorial covered the process of enabling the Magento 2 Profiler using .htaccess file edits and CLI commands. It also highlighted the benefits and various output formats for analyzing performance data.
Explore Magento hosting options for peak performance and enhancing store operations.


